






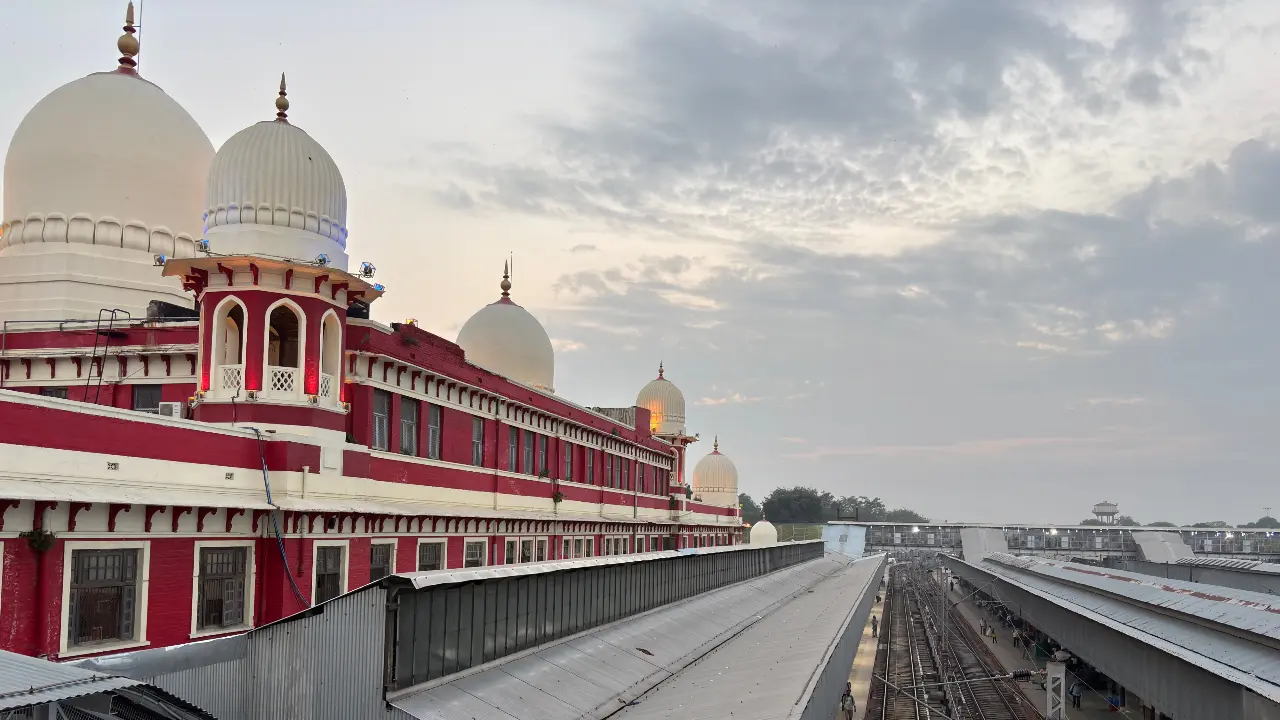
The Swachh Vayu Sarvekshan 2026 rankings have placed Lucknow at the top among India’s million-plus population cities, while Kanpur stands at the 11th spot. But behind these numbers is a more layered story, one of cleaner-air efforts, ongoing pollution challenges and the reality that a city’s air can change dramatically with the seasons.
Conducted under the National Clean Air Programme (NCAP), the survey looks beyond just pollution levels. It evaluates how cities are tackling the problem through clean-air action plans, pollution-control measures, waste management, public participation and monitoring systems.
Lucknow’s air story: A better rank, but more work ahead
For Lucknow, the No. 1 position in the rankings comes against the backdrop of several pollution-control measures implemented under its clean-air action plan. The city scored 198 points, followed by Indore (197) and Jabalpur (195). The measures considered in the assessment include initiatives such as mechanised road sweeping, electric vehicles for public transport and waste collection, improved waste management, Miyawaki plantations and vertical gardens.
At the local level, Ward-70 in Zone-4 secured the No. 1 position nationally among urban wards with populations above 30,000. However, the ranking does not represent a complete resolution of Lucknow’s air-quality challenges. The city’s annual PM10 concentration remains above the prescribed standard of 60 µg/m³, with the current level reported at 137 µg/m³. Data under NCAP shows that PM10 levels have declined from 250 µg/m³ in 2017-18 to 137 µg/m³, a 45.2% reduction, though further improvements will depend on continued action on pollution sources and year-round monitoring.
A ranking dip amid a long industrial battle for Kanpur

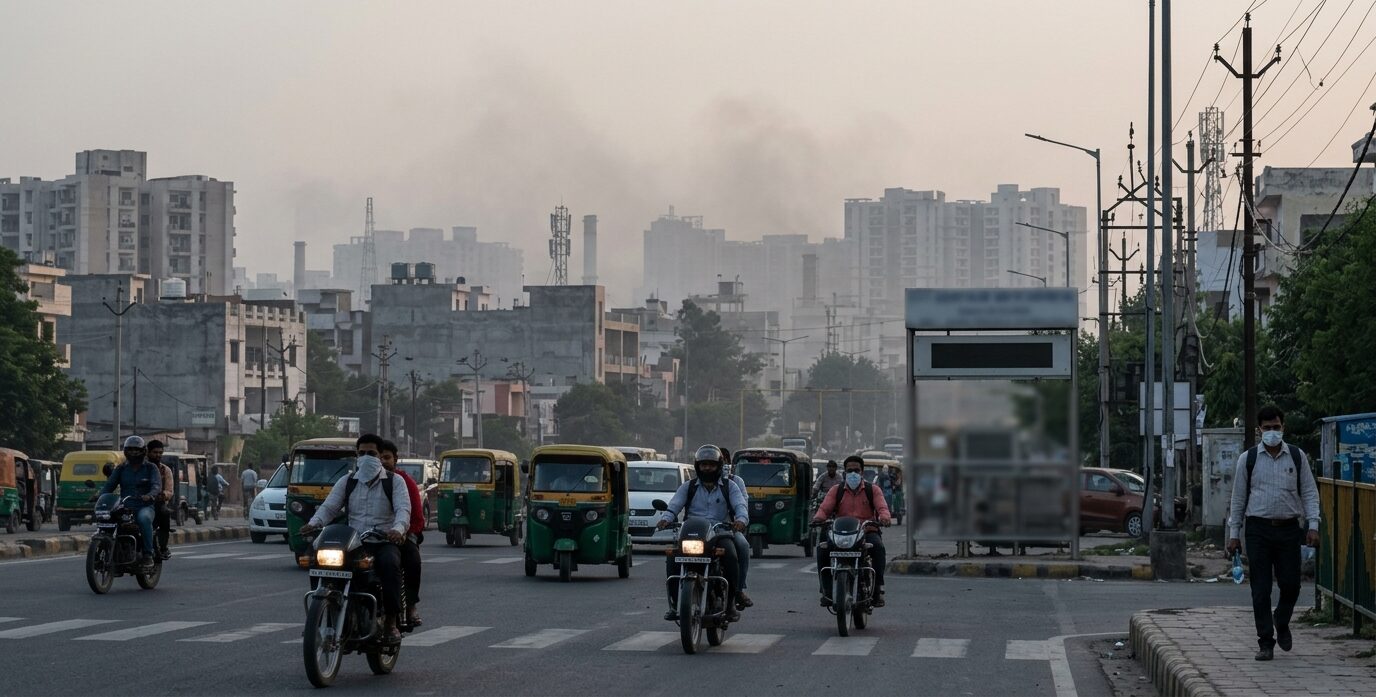
Kanpur’s journey is more complicated. A city built on industrial strength, it has spent years dealing with the environmental costs that come with factories, traffic and rapid urban growth. In the latest survey, Kanpur slipped from its earlier top 5 position to rank 11 among million-plus cities. The drop highlights the challenges ahead, even as the city continues efforts around emission monitoring, cleaner industrial practices and pollution control.
Decoding the clean-air numbers

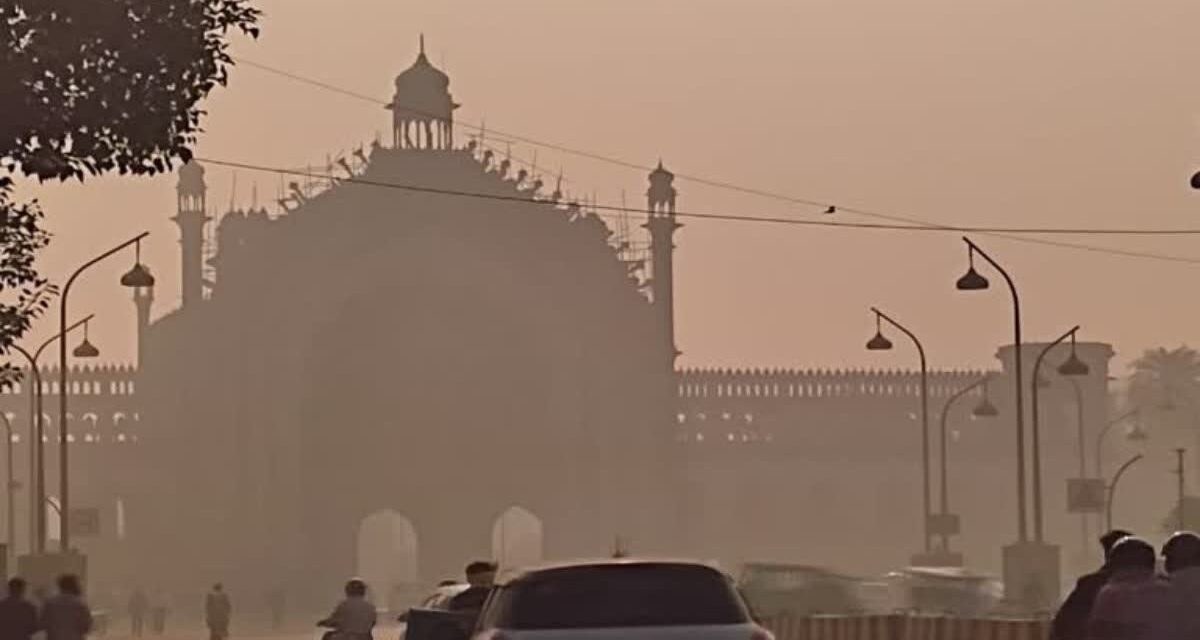
The above rankings point to a wider clean-air effort across Uttar Pradesh, with 16 cities making it to the national assessment. But the numbers need some context. Swachh Vayu Sarvekshan looks at how cities are fighting pollution through action plans, monitoring and control measures, not just what the AQI looks like on a particular day.
For Lucknow and Kanpur, the real test often begins when winter arrives. Cooler temperatures, slower winds and Diwali emissions can quickly change the air people wake up to. In previous years, Lucknow’s PM10 levels jumped from 217 µg/m³ before Diwali to 451 µg/m³ on Diwali night, while PM2.5 rose from 114 µg/m³ to 324 µg/m³ during the same period. Kanpur, too, has witnessed similar seasonal pollution spikes.
That is why a clean-air ranking is only one part of the story. While long-term efforts around dust control, waste management and emissions can make a difference, weather and festive pollution can quickly shift the AQI. For residents, clean air is not just a position on a chart, it is the clarity of a winter morning, the visibility on their daily commute and the ease of stepping outdoors. The real achievement will be when cleaner air becomes something people experience all year round, not just something reflected in a survey.
